
Estimation of pest population abundance
Pest control companies, depending on the sector where they carry out their business, have the need to go from being simple occasional controllers to having to present evident and lasting results to their clients and...
Technical summary
- Focus
- Pest control companies, depending on the sector where they carry out their business, have the need to go from being simple occasional controllers to having to present evident and lasting results to their clients and to...
- Approach
- It brings together technical criteria linked to Edición 16, abundancia poblacional and latam plagas.
- Use
- Useful for professionals who need context, diagnosis and operational decisions in integrated management.
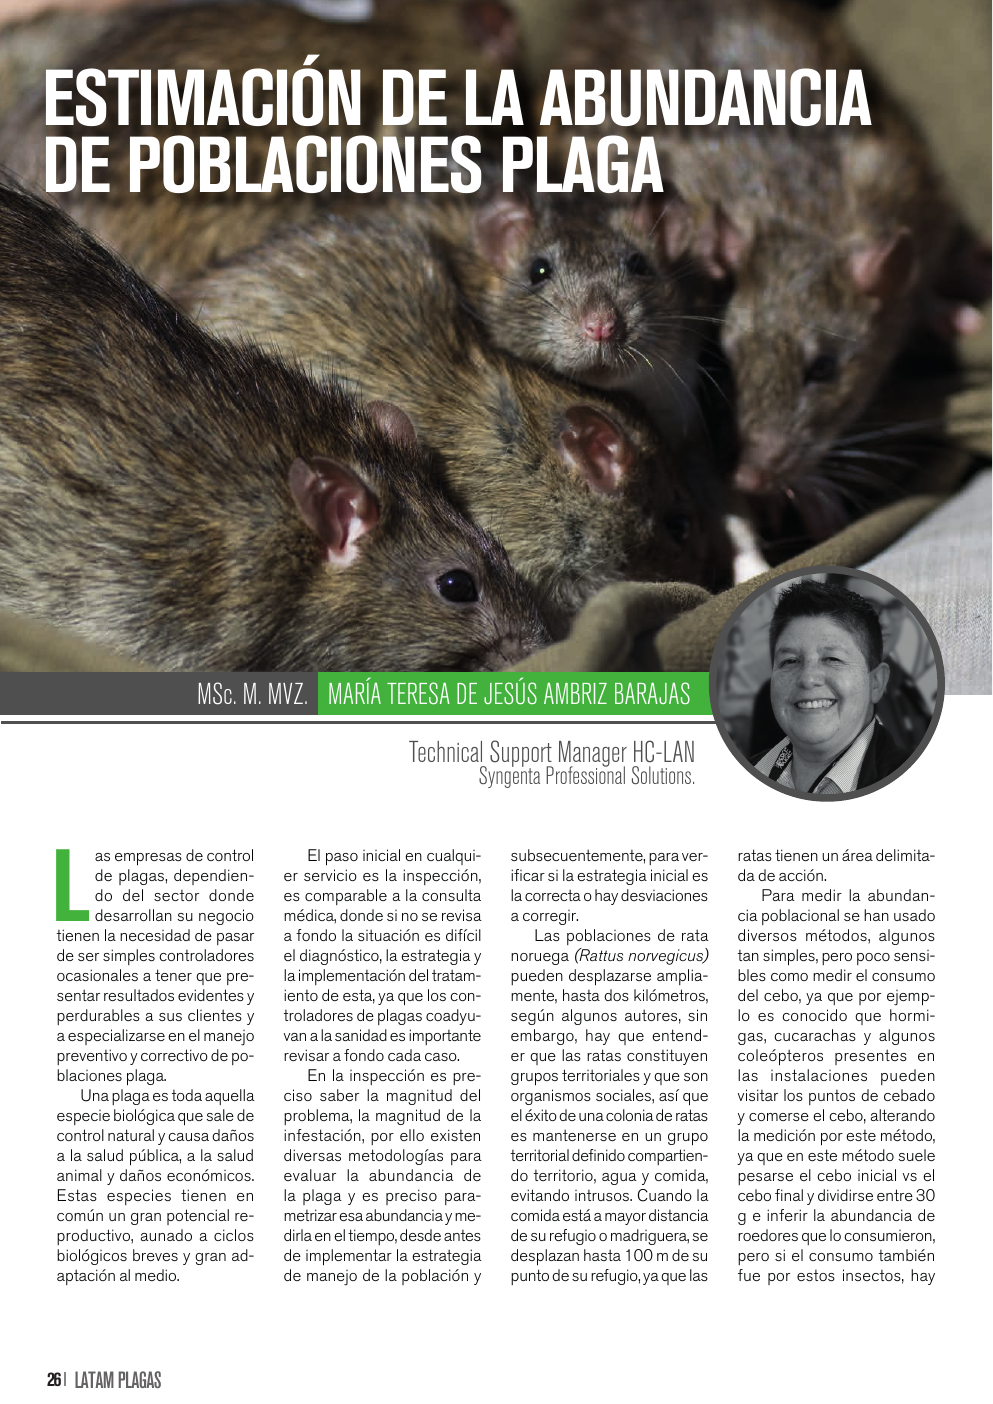
Pest control companies, depending on the sector where they carry out their business, have the need to go from being simple occasional controllers to having to present evident and lasting results to their clients and to specialize in the preventive and corrective management of pest populations. A pest is any biological species that gets out of natural control and causes damage to public health, animal health and economic damage. These species have in common a great reproductive potential, combined with short biological cycles and great adaptation to the environment. The initial step in any service is the inspection, it is comparable to the medical consultation, where if the situation is not thoroughly reviewed, the diagnosis, strategy and implementation of its treatment is difficult, since Pest Management Professionals contribute to health, it is important to thoroughly review each case. In the inspection, it is necessary to know the magnitude of the problem, the magnitude of the infestation, which is why there are various methodologies to evaluate the abundance of the pest and it is necessary to parameterize that abundance and measure it over time, before implementing the population management strategy and subsequently, to verify if the initial strategy is correct or there are deviations to correct. Norway rat (Rattus norvegicus) populations can move widely, up to two kilometers, according to some authors. However, it must be understood that rats constitute territorial groups and that they are social organisms, so the success of a colony of rats is to remain in a defined territorial group, sharing territory, water and food, avoiding intruders. When the food is further away from their shelter or burrow, they move up to 100 m from their shelter point, since rats have a delimited area of action. To measure population abundance, various methods have been used, some as simple but insensitive as measuring bait consumption, since for example it is known that ants, cockroaches and some beetles present in the facilities can visit the baiting points and eat the bait, altering the measurement by this method, since in this method the initial bait is usually weighed vs. the final bait and divided by 30 g and infer the abundance of rodents that consumed it, but if the consumption also It was because of these insects, there is an important deviation. Methods with greater statistical validity are, for example, the following, which are widely used in agriculture: 1) Lincoln Index or Capture and Recapture: the most used: by mopping with Sherman-type traps. The formula to apply is: A= individuals initially captured. Note: these must be checked. B= individuals captured in total in the second sampling C=individuals captured in the second sampling marked or “recaptured” 2) Petersen method: 100 Sherman-type traps placed in a network, equidistant. Two samplings without exceeding 3 days between them. Formula is applied: A= individuals initially captured. Note: these must be checked. D= individuals captured in total in the second sampling C=individuals captured in the second sampling marked or “recaptured”. Where B = Number of recaptures in second sampling (C) Total number of captures in second sampling (D) 3) Joule Cameron method or elimination of trapped animals: 100 Sherman or guillotine traps in equidistant rows for 3 nights. What was caught in 3 nights represents 90% of the population. 4) Trapping success: the number of individuals counted through the application of a controlled registration effort. 5) Trapping effort: number of traps placed per number of days they worked. For example: if 10 lethal capture traps (guillotine type) are placed per night for 3 consecutive nights, the capture effort made will be 10 x 3 = 30. However, in the practice of pest control these agricultural methodologies are impractical, which is why population abundance, especially of rats, is inferred from other indices such as these: 6) Harold Gunderson: scale based on the observation of the presence or non-presence of rats:
- Rats are never observed: 1 to 100 rats.
- Rats are occasionally seen at night, but not during the day: 100 to 500 rats.
- Many rats at night and several during the day: 1,000 to 5,000 rats. 7) Gil Berduque, based on the previous index:
- If only droppings are observed: 1-100 rats or 1 rat / 20 m2.
- If rats are observed irregularly only in the afternoon or at night: 100-500 rats or 1 rat / 5 m2.
- If rats are observed throughout the afternoon or night and irregularly during the day: 5001000 rats or 1 rat/m2.
- If observed at night and frequently during the day: 1000-5000 rats or 2 or more rats/m2. 8) Robert Corrigan method. Important for burrowing rats such as the Norway rat and is based on a count of active burrows and parameterized with the following formula: 20% is added to the estimated number of rats if food is abundant, 20% is subtracted if food is not available. Being able to have a population abundance parameter is the basis for designing the strategy, since within integrated pest management and more so in rodents, a prevalent method is chemical control, with rodenticide baits and the amount of bait to be placed at each stage and the zoning of the baiting points must be quantified, which has greater precision if population monitoring is carried out to obtain population abundance. If the initial population abundance were 500 rats in a facility and without having determined it, empirically 20 g of bait would be placed per baiting point and these were 30 bait stations, there would be 600 g of bait placed, which is insufficient for such a large population and whose average consumption in adults is 30 g per day. The supply of bait is insufficient and even more so if a bait is chosen whose average acute oral lethal dose (LD50) for that species is high and therefore the population requires consuming a greater amount of bait to reach the lethal dose. Choosing the appropriate rodenticide bait is vital to achieve the reduction of the rodent population in the shortest possible time, since the “rose pruning” effect on a population encourages the population to replenish itself and the infestation to persist. Klerat® blocks and Klerat® pellets are rodenticide formulations designed to reduce the population based on high performance in preferential consumption by rodents, given the succulent “High density” formulation based on different cereals and the speed of control, since they contain the most powerful second generation anticoagulant, Syngenta's Brodifacoum with a high degree of purification for optimal effectiveness. With Klerat® more is achieved with less, thanks to the balance of high palatability and greater rodenticide power.
BIBLIOGRAPHICAL REFERENCES: Gil Berduque J.A. Cleaning, disinfection, disinfestation and deratization in cattle farms. XI International Congress of Bovine Medicine ANEMBE. Zaragoza, Spain. Said-Velasco A, Nava-Nava R. Domestic rats and mice. Methods and alternatives for its control. Mexico: LIMUSA. 1988.